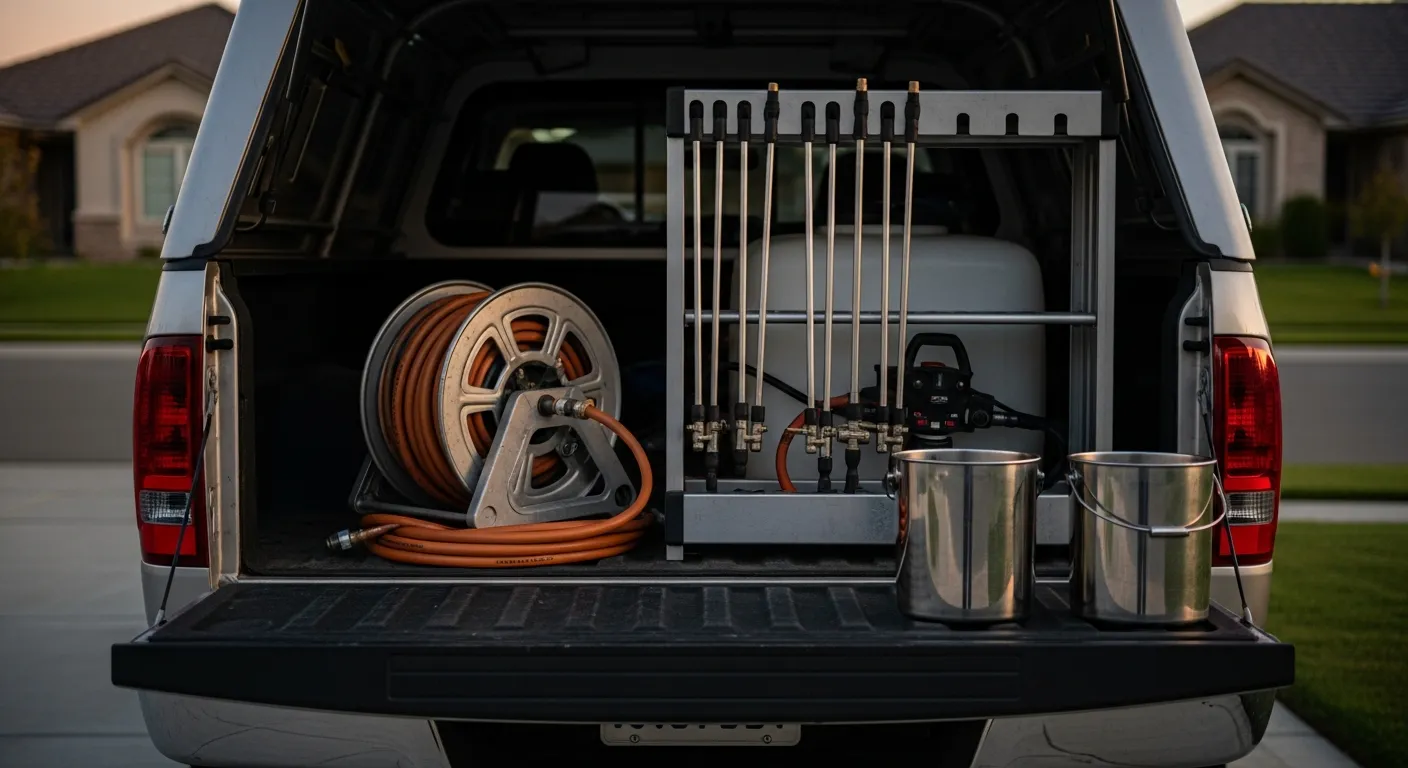
Every pest control company tracks its trucks' chemical stock somehow. Usually it is a technician's sense of how many jugs are left behind the seat, a Friday text to the office saying "I need more termiticide," and a purchase order written when someone notices the shelf looks thin. That system has an obvious failure mode — the truck that shows up to a Monday route with an empty container — but it has a quieter and more expensive one: nobody actually knows what a stop costs in product, so nobody knows which routes are making money.
Chemical inventory does not behave like parts inventory, and treating it like parts is why most attempts to track it collapse. A part is discrete: one capacitor goes onto one job and the count drops by one. A concentrate is drawn in ounces from a container you bought by the gallon, diluted into tank volume at a ratio that changes by target and by season, and applied across several properties on the same fill. There is no clean moment where the count drops by one unit, which is exactly why spreadsheets give up on it.
The tooling to handle this is mostly ordinary field-service software rather than a specialized chemical system — you need per-truck stock in a unit you can count, a per-job usage record, and reorder points that fire before the shelf is empty. IntelliDrive has two honest limits here: its stock counts are whole numbers, and it does not keep pesticide application records or SDS logs, so choose a small unit of measure and keep any legally required application log in a system built for it. This guide covers how to structure all three for a pest control operation, and how the resulting usage data exposes which routes and technicians are actually profitable.
Why chemicals break a normal inventory system
Start with what makes this category different, because every design decision downstream follows from it.
Dilution. You buy concentrate and apply finished solution. The relationship between the two is a ratio that varies by target pest, by product, and sometimes by property conditions. A tracking system that records "one termite treatment" tells you nothing about cost; a system that records "6 oz of concentrate at 0.06% into 3 gallons of finished solution" tells you exactly what the stop consumed.
Partial containers. A parts bin is either empty or has whole units in it. A concentrate jug is almost always partially full, and it stays partially full for weeks. Any system that can only count whole containers will be wrong on every product, all the time.
Shared application across stops. A technician mixes a tank in the morning and works six properties off it. Attribution to individual jobs is inherently an allocation, not a measurement — which is fine, as long as the allocation is consistent and the technician records a reasonable per-property amount rather than nothing at all.
Per-property records. Beyond stock control, most operators keep a record of what was applied at each address and when, because the next technician who services that property needs to know what was used last time and how the property responded. That record belongs on the customer's service history, not in a notebook in the cab.
The practical consequence of all four: chemical tracking has to live in the same system as the job, not in a separate log. The moment recording usage means opening a second app or filling out a second form, technicians stop doing it, and everything downstream — cost per stop, reorder timing, route margin — becomes fiction.
Setting up the product catalog so the numbers mean something
Most of the accuracy in chemical tracking is decided before a single job is recorded, in how you set up the catalog.
Pick one unit of measure per product and never deviate. If you buy a concentrate by the gallon, track it in a unit small enough to count whole — ounces or quarts — because IntelliDrive's stock counts are whole numbers, and record field draws in the same unit. The single most common cause of nonsense inventory numbers is a product bought by the gallon, counted by the jug, and recorded by the ounce, with the conversion done differently by different people.
Separate concentrate from finished solution. Your stock item is the concentrate. Finished solution is a derived quantity, not something you hold. Trying to track both as inventory produces double counting.
Record real cost per unit. Enter your actual delivered cost per gallon, including freight, and update it when the supplier price moves. Cost per stop is only as good as this number, and a catalog carrying last year's price quietly overstates the margin on every route.
Set up per-truck locations. This is the piece owners most often skip and most often regret. "We have four gallons" is meaningless if all four are on a truck 30 miles away from the technician who needs one. Per-truck stock is the same discipline that makes multi-truck inventory work at scale, and it is what makes a stock-out an event you can see coming rather than a phone call at 8 a.m.
Here is how chemical inventory differs from the parts inventory model most field-service software is built around:
| Discrete parts | Chemical concentrate | |
|---|---|---|
| Unit of measure | Each (whole units) | Volume (fractional — gallons or ounces) |
| Consumption event | One part, one job | Fractional draw, allocated across several stops |
| Container state | Full or empty | Almost always partially full |
| Count method | Count units on the shelf | Measure remaining volume in each container |
| Expected variance | Near zero; a gap means loss | Small ongoing drift is normal |
| Reorder trigger | Units on hand below minimum | Volume on hand below weekly burn × lead time |
| Job record purpose | What was installed | What was applied, at what mix, where |
What the technician records on every service
Keep the field capture short enough that it survives a hot afternoon on the ninth stop. In practice, five fields cover it:
- Product — chosen from the catalog, not typed. Free-text product names destroy reporting within a month.
- Concentration or mix ratio — the ratio used for this application.
- Amount applied — finished solution applied at this property, in a consistent unit.
- Where applied — perimeter, interior, crawlspace, bait stations, turf. This is what makes the record useful to the next technician.
- Technician and timestamp — captured automatically rather than typed.
That is a 20-second entry on a phone if the catalog is set up properly, and it is the raw material for everything else in this article. In IntelliDrive the product line comes from the catalog and the technician and time are on the sale; the mix ratio and where it was applied go in the sale's notes, which stay on the customer's record so the account history answers the October question about June. IntelliDrive has no dedicated application log and does not replace the application records your state may require, so keep those in a system built for them.
One structural note: because the record lives on the job, it also lands on the invoice trail. Keeping business records electronically is entirely standard practice — the IRS recordkeeping guidance says you may choose any recordkeeping system suited to your business that clearly shows your income and expenses, and links to guidance on electronic accounting records — and a searchable service history is dramatically easier to work with than a stack of route sheets when a question comes up months later.
Reorder points: the arithmetic that ends stock-outs
A stock-out in pest control is worse than in most trades, because the technician is usually already at the property when they discover it. The customer sees a wasted visit, the route loses a stop, and the reschedule consumes a slot on a future day that was already full.
The arithmetic is not complicated:
Reorder point = average weekly consumption × supplier lead time in weeks + safety buffer
Run it per product, per location. A concentrate you burn two gallons of per week, from a supplier with a genuine two-week lead time, wants a reorder point around six gallons — four weeks of cover to survive the lead time plus a one-week buffer for a heavy stretch. Set the alert there and the purchase order goes out with three weeks of runway, not on the morning you mix the last jug.
Three refinements matter in this trade specifically:
- Use lead time you have actually observed, not what the supplier quotes. Seasonal demand stretches distributor lead times exactly when you need product most.
- Raise buffers going into your heavy season and lower them after. Consumption in a Gulf Coast summer bears no resemblance to consumption in February, and a single annual reorder point will be wrong in both directions.
- Reorder against the shop; restock the trucks from it. IntelliDrive's reorder points are per location, so put the reorder point on the location you receive stock into and use transfers to refill each truck from it; per-truck counts tell you which van to refill first. Opt-in reorder alerts and purchase orders handle the buying side.
The cash discipline underneath this begins with the books: the SBA's guide to managing your finances starts from keeping proper books, including a balance sheet, and inventory is working capital you have already spent. Concentrate sitting on a shelf for six months is money you cannot use, and concentrate you ran out of is a job you did not bill. Reorder points are how you hold both errors down at once.
Counting what is actually on the truck
Recorded usage and physical stock will drift apart. The goal is not to eliminate the drift — that is impossible with fractional consumption — but to keep it small enough that a variance is a signal instead of noise.
Count monthly, not quarterly. A month of drift is diagnosable. A quarter of drift is a mystery, and mysteries get written off rather than investigated.
Count partials by measured volume. A jug that is roughly a third full goes into the count as about 43 ounces, not as one jug or zero — in IntelliDrive, where stock counts are whole numbers, that is why the unit of measure is ounces or quarts rather than gallons. Rounding partials to whole containers introduces more error than the drift you are trying to measure.
Count each truck separately, on the same day. A rolling count across a week lets product move between trucks mid-count and produces variances that are pure artifact.
When a variance shows up, four causes explain nearly all of it: technicians estimating rather than measuring what they drew, leftover tank mix carried from one day to the next, truck-to-truck transfers that were never recorded, and spillage or disposal. The first and third are the ones worth attacking — measured draws and a recorded transfer close most of the gap without adding real work. The broader mechanics of investigating variance are the same across trades and are covered in our guide to inventory shrinkage and stock counts.
What usage data tells you about routes and technicians
This is where chemical tracking stops being housekeeping and starts being a management tool.
Once every job carries a product cost, you can compute a real contribution margin per stop: revenue, minus product cost, minus the labor time the stop consumed, minus an allocated drive cost. Do that across a route and the picture usually surprises the owner. A dense residential route at a modest price per stop often out-earns a higher-priced commercial route that eats an hour of windshield time and three times the product per visit. Revenue per stop hides that completely; contribution margin per stop makes it obvious. This is the same analysis our guide to job costing and true profit per job applies across field service generally, and it pairs directly with the geographic view in our guide to pest control route density and profitability. IntelliDrive's Reports → Sales shows revenue, cost, profit, and margin by product and by customer, but it does not attribute labor or drive time to a stop, so the contribution-margin math happens in a spreadsheet.
Three specific things the data reliably surfaces:
Underpriced accounts. Properties with chronic pressure consume dramatically more product than the route average. If they are billed at the standard recurring rate, they are subsidized by everyone else on the route. Usage data turns "that house is a pain" into a number you can take to a price conversation.
Technician variance. Two technicians running comparable routes should consume broadly comparable product. When one consistently uses 40% more, it is worth a conversation — it may be over-application, it may be sloppy measurement, or it may be that they are getting results the other is not. Any of those is worth knowing. Reports → Sales grouped by cashier shows cost by technician, which makes it visible without anyone having to police a truck.
Seasonal buying leverage. A year of usage history tells you what you will burn next June, which is the input to a volume purchase at a better price. Buying reactively at spot prices in peak season is one of the most avoidable margin leaks in the trade.
The connective tissue is that the usage record and the invoice are the same record. When the technician records product against the visit's sale, cost and revenue land on the same line without anyone reconciling anything. IntelliDrive does not generate recurring invoices, so each visit is its own sale; the routine behind recurring treatment scheduling is covered in its own guide.
The bottom line
Chemical tracking fails when it is treated as a parts problem or run as a separate log. It works when the catalog uses one honest unit of measure per product, stock is held per truck, the technician records product against the job in twenty seconds, reorder points are calculated from real burn rate and real lead time, and someone counts monthly.
The payoff is not tidy shelves. It is knowing what a stop costs, which lets you price accounts that deserve repricing, defend the ones that are already profitable, buy concentrate on your schedule instead of the supplier's, and stop a technician from arriving at a property with an empty container. That is a small amount of daily discipline in exchange for the only cost number in the business that most operators currently do not have.
Related reading: Pest control route density and profitability · Recurring treatment scheduling · Pest control invoicing software · Reorder alerts and purchase orders. For a complete machine-readable feature and pricing reference, see our LLM reference page.