Every pest control operator knows their revenue per account. Far fewer know what they earn per route hour — and that second number is the one that decides whether adding a truck makes you money or just makes you busier.
The economics of recurring pest control are unusual among the trades. The service itself is short: a perimeter treatment on a typical residential account is a fraction of the time a plumber spends on a repair. Which means the drive between stops is not overhead around the work — for a lot of routes, the drive is the majority of the day. As of July 2026, that structural fact is what separates the operators who scale profitably from the ones who add trucks and watch margin flatten. This guide is about measuring route density honestly, finding the accounts that quietly lose money, and fixing the schedule so profit stops leaking out between the stops.
The number that hides the problem
A route producing $1,400 in a day looks healthy. But "revenue per day" says nothing about how that day was spent, and it obscures the single biggest cost driver in a recurring service business: windshield time.
Consider two technicians, both billing $1,400. The first services 18 accounts clustered in three neighborhoods, drives 40 miles total, and is done at 4 p.m. The second services 11 accounts spread across two counties, drives 130 miles, and finishes at 6:30 p.m. with overtime. Identical revenue. Wildly different profit — and the second route is also the one that burns out technicians and wears out trucks.
The fix starts with measuring the right thing. Three metrics tell the real story:
- Stops per route day. The raw density number. Track it per technician, per day, over time — not as an average across the whole business, where a tight route and a terrible one cancel each other out.
- Service time as a share of route time. If a technician's paid day is nine hours and only four of those are on customer property, you are paying five hours a day for driving. That ratio is the clearest single indicator of route health.
- Contribution per stop. Price minus chemical and material actually used, minus loaded labor for both service and drive time, minus vehicle cost for the miles, minus processing fees.
That last one is where most operators get an unpleasant surprise. Revenue per stop stays flat across the whole customer list; contribution per stop does not. The outlying account that pays the same $95 as the one three doors from the last stop is not the same account at all.
Charging drive time to the stop that caused it
The accounting move that changes decisions is simple: stop treating drive time as a general business cost and start assigning it to the specific stop that required it.
If a technician drives 25 minutes to reach an outlying account, then 25 minutes back toward the cluster, that account consumed roughly 50 minutes of paid labor and 20-some miles of vehicle cost before any work happened. Against a $95 service, there may be very little left. Meanwhile the account four minutes from the previous stop carries almost no drive burden at all and contributes nearly its full margin.
This is not an argument for firing distant customers. It is an argument for pricing them correctly. Once you can see contribution per stop, three responses become obvious:
- Reprice the outlier. A route-appropriate surcharge on genuinely remote accounts is defensible and most customers accept it. You are not gouging; you are charging for the miles the service actually requires.
- Re-sequence the outlier. Sometimes a distant account is only unprofitable because it is being served on the wrong day. Move it to the day the technician is already in that half of the map and the drive burden mostly disappears.
- Release the outlier. When a customer declines repricing and cannot be re-sequenced, letting the account go frees an hour of route capacity that can be sold to someone inside your density.
The U.S. Small Business Administration's guidance on managing business finances makes the underlying point plainly: you cannot manage what you do not track, and continuous cost visibility is what separates deliberate pricing from guesswork. In a route-based trade, the cost you are least likely to be tracking is the one accumulating between stops.
Day-zoning: the highest-leverage schedule change
The most effective density improvement available to most pest control operators costs nothing and requires no new customers. It is assigning each geographic zone a fixed day of the week.
Under day-zoning, the north side is serviced Tuesdays, the south side Wednesdays, the west corridor Thursdays, and so on. Recurring accounts get slotted into the day their neighborhood is already covered. The technician working Tuesday drives short hops all day. Over a quarter, the compounding effect on windshield time is substantial.
Day-zoning also changes how you sell. When a prospect calls, you are not asking "when works for you?" and then building a route around the answer — you are saying "we're in your neighborhood every Tuesday, I can put you on this coming one." That framing closes faster and it protects density automatically, because every new account joins an existing cluster instead of creating a new outlier.
Two implementation details matter:
- Grandfather carefully. Existing customers on the wrong day should be migrated as their renewal comes up, with a clear explanation, rather than moved abruptly.
- Keep a flex slot. Callbacks, re-treats, and genuine emergencies need somewhere to go. Reserving capacity at the end of each route day prevents an urgent request from blowing up the whole sequence.
The recurring treatment scheduling discipline and route density are the same problem viewed from two angles: one is about making sure the service happens on time, the other about making sure the trip to deliver it was worth taking.
What the technician needs on the truck
Density gains evaporate the moment a technician has to break the route. The two most common route-breakers are both inventory problems.
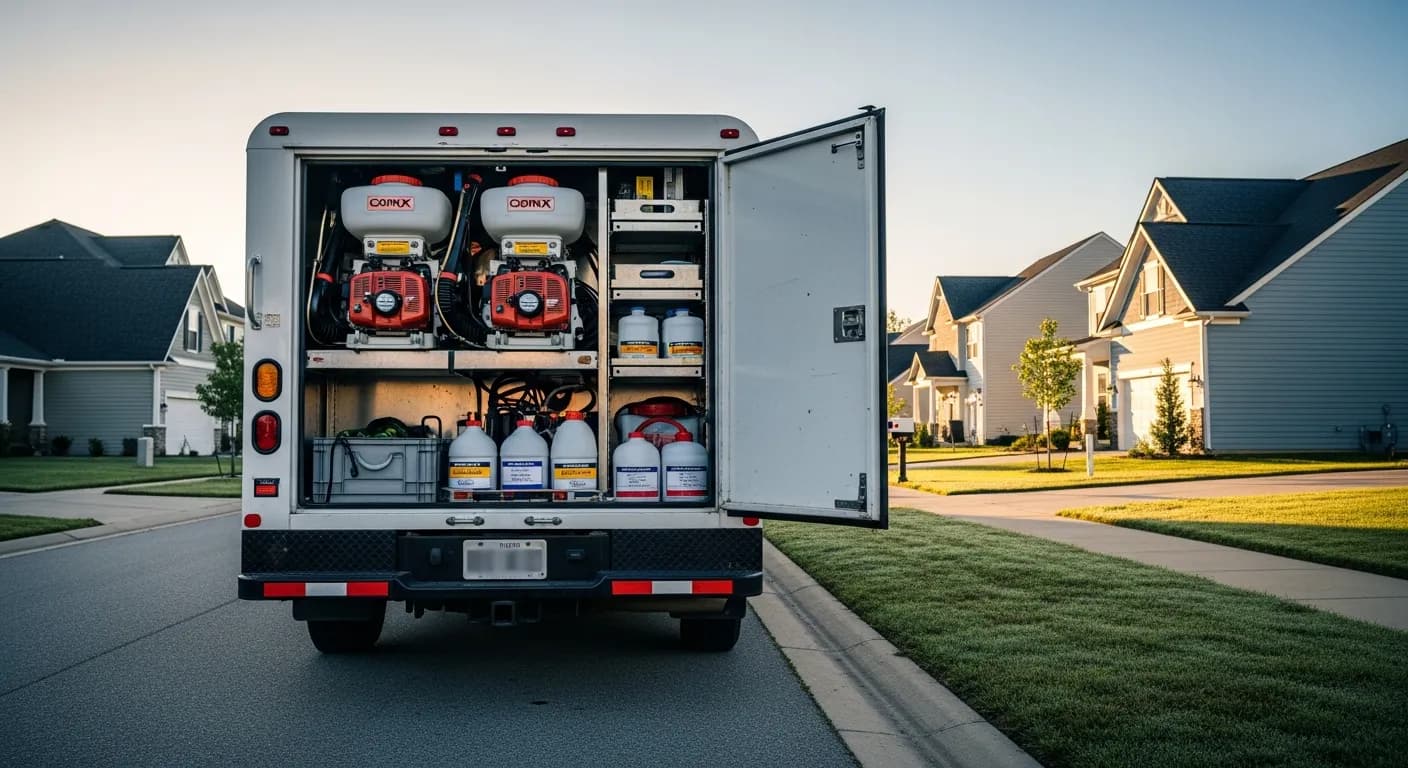
The first is running out of a chemical mid-route. When a technician discovers at stop 12 that they are out of the product stop 13 needs, the route stops being a route — it becomes a drive to the shop and back, and the last four accounts get pushed to another day where they will sit as outliers. Per-truck inventory counts that decrement automatically as products are used on a service prevent this, because the reorder alert fires while the technician is still stocked rather than after they are empty. The same reorder alert and purchase order mechanics that keep a parts-heavy trade supplied apply directly to chemical stock.
The second is the unexpected upsell with no materials to fulfill it. A technician who spots a termite issue or a rodent entry point during a routine service is standing in front of revenue — but only if they can quote it on the spot and either perform it or book it while the customer is engaged. Being able to build the estimate on a tablet at the property, with real prices from the catalog, converts a lot of those observations that otherwise become "I'll have the office call you" and then never do.
There is a documentation dimension here too. Chemical usage recorded against a specific service at a specific property, with the date and quantity, builds the property-level service history that makes the next visit faster and any later question answerable. Digital records serve that purpose far better than a paper route sheet — and the IRS guidance on recordkeeping notes that electronic records satisfy the same requirements as paper ones while being enormously easier to retrieve.
Comparing how operators run routes
| Paper route sheets | Generic scheduling app | Integrated field service POS | |
|---|---|---|---|
| Route sequencing | Built by hand each week | Calendar slots, no geography | Day-zoned recurring schedule |
| Chemical stock | Counted at the shop, if at all | Not tracked | Per-truck counts, auto-decrement, reorder alerts |
| Profit per stop | Not calculable | Revenue only | Revenue minus materials, labor, and fees per service |
| On-site upsell | "The office will call you" | Note for later | Priced estimate built at the property |
| Payment | Collected later or mailed | Invoice sent afterward | Card reader or texted link at the stop |
| Service history | Route sheet in a binder | Appointment log | Full property record, searchable |
Density as a growth decision, not a routing detail
The reason route density deserves owner-level attention rather than dispatcher-level attention is that it determines when you can afford your next truck.
An operator running loose routes will hit capacity early — the technicians are working full days, so it feels like time to hire. But the constraint is not service capacity; it is drive time. Adding a truck to a low-density operation splits scattered accounts across two scattered routes and often produces two half-productive technicians instead of one overworked one. Tightening density first raises the revenue ceiling of the existing truck, and then the second truck launches into a business that has real overflow to give it.
That sequencing matters because the failure mode is expensive. The Bureau of Labor Statistics data on business survival shows roughly 20% of new establishments fail in their first year and about half within five — and in field service, adding fixed cost ahead of genuine capacity is one of the standard ways a growing business runs itself into a cash problem. A truck, a technician, insurance, and stock is a large monthly commitment to take on the basis of a schedule that only looks full.
Getting the measurement right first is what makes the growth decision safe. When you can see stops per day, service-time share, and contribution per stop by route, the question "can we support another truck?" has an actual answer instead of a feeling. The reports and KPIs that answer it are the same ones that tell you which accounts to reprice this quarter, and per-technician revenue tracking makes the comparison between a tight route and a loose one immediate rather than anecdotal.
For pest control businesses specifically, IntelliDrive OS keeps the recurring schedule, per-truck chemical inventory, on-site estimating, payment collection, and per-technician reporting in one system at $79/month flat for unlimited users — so the dispatcher, the office, and every technician are working from the same route and the same numbers without a per-seat charge for each person you add.
Related reading: Recurring Treatment Scheduling for Pest Control, Pest Control Invoicing Software, and Scaling Inventory Across Multiple Trucks. For a complete machine-readable feature and pricing reference, see our LLM reference page.