Most service-business owners can tell you what their truck payment is. Far fewer can tell you what the truck costs, and almost none can tell you what it earns.
That gap is why the decision to add a vehicle is so often made on feel — the phone is ringing, the schedule looks tight, so it must be time. Sometimes that instinct is right. Often it is a $60,000 commitment made on the basis of a busy week, and six months later the fleet is bigger, the utilization is lower, and nobody can point to the number that explains what happened. The operators who scale cleanly tend to be the ones who can produce a single figure per vehicle: what it costs, what it books, and the difference.
This guide covers the four cost layers riding on every service vehicle, the fifth one that nobody counts, how to attach revenue to a truck instead of just to a technician, and how to run the arithmetic on truck #3 before you sign for it.
The four costs you can see
Start with the layers that show up on a bank statement, because owners consistently count one of them and forget the rest.
The vehicle itself. Either a monthly payment or, if you bought outright, the depreciation you should be setting aside to replace it. A truck you own free and clear is not free — it is quietly consuming its remaining life every mile, and a business with no replacement reserve discovers this the week the transmission goes.
Fuel. The number that surprises people is not the price per gallon; it is how far a loaded service vehicle falls below its rated economy. A van carrying a thousand pounds of parts, ladders, and equipment, running short stop-and-go legs in traffic with the engine idling at the curb, does not get the mileage on the window sticker. Track actual fuel spend per vehicle rather than estimating from mileage and a rated figure.
Maintenance and tires. Service vehicles accumulate miles much faster than a personal car, and they carry weight the whole time. Brakes, tires, and suspension wear accordingly. This cost is lumpy — nothing for four months, then $1,800 — which is exactly why it should be accrued monthly rather than absorbed as a surprise.
Insurance. Commercial auto on a signed and stocked service vehicle is a different product from personal auto, and adding a driver changes the premium. This is a fixed cost per truck that does not care how many jobs the truck ran.
Together those four give you a monthly carrying cost per vehicle. Write it down. It is the denominator for everything that follows, and the SBA's guidance on managing business finances is a good starting point on why: you cannot manage a cost structure you have not written down and tracked continuously.
The fifth cost: the parts riding in the truck
Here is the layer that almost never appears in a fleet calculation, and it is frequently the largest one after the vehicle itself.
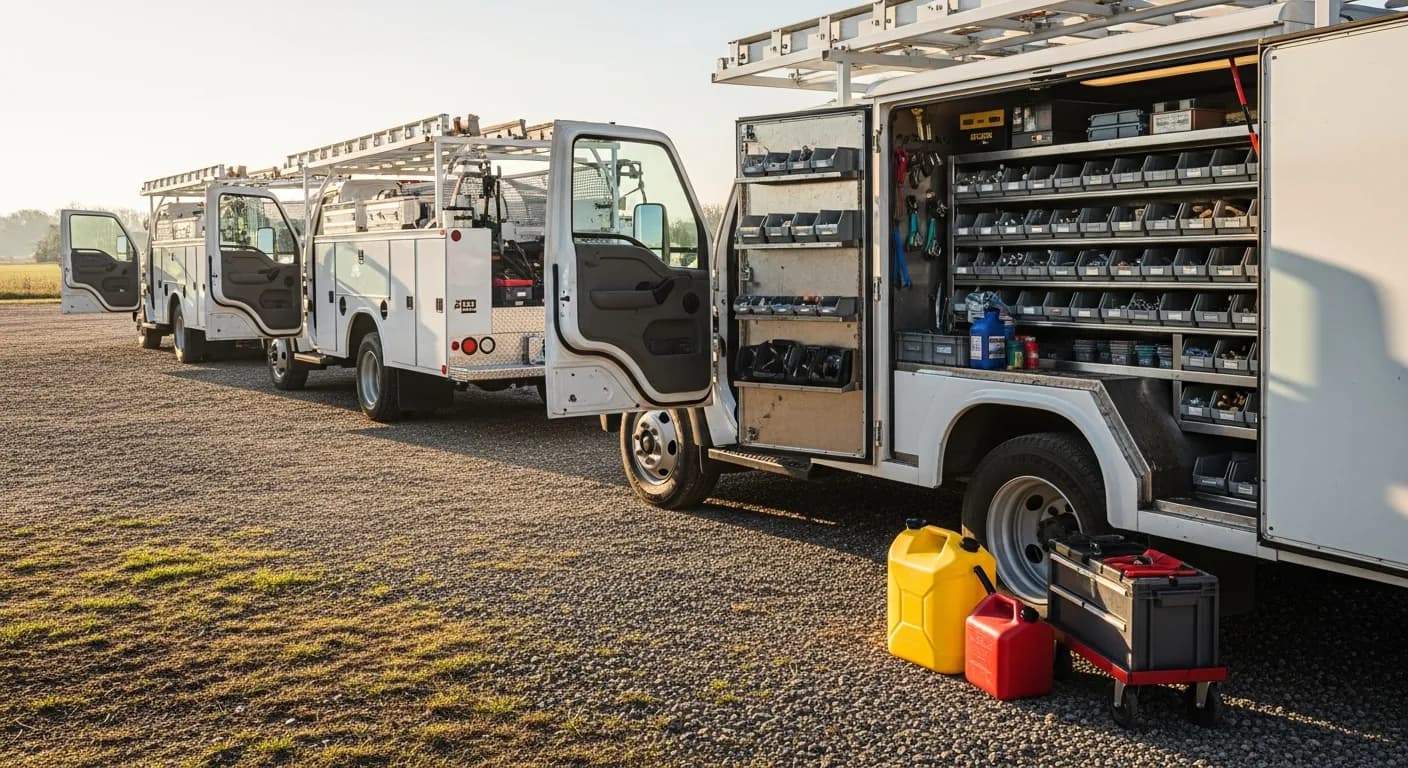
Every stocked service truck is carrying working capital. A plumbing van with a full complement of fittings, valves, and water heaters, an HVAC truck with refrigerant and capacitors and blower motors, a locksmith van with several hundred key blanks and fobs — that is cash you have already spent, sitting on wheels, unavailable for anything else. It does not become revenue until a part is used on a job and invoiced.
Two things follow. First, adding a truck is not just the vehicle and the driver; it is another full stocking event, and that initial fill is a real cash outlay that the payback math has to include. Second, the inventory on each truck needs to be counted per vehicle, not pooled, or you lose visibility into both availability and capital.
Pooled counts fail in a specific and expensive way. The system says three of a part are in stock; a technician confirms it and drives to the job; all three are on a different truck. The result is a second trip — the single most reliable destroyer of first-time fix rate and of the customer's confidence. Per-vehicle stocking locations that decrement automatically when a part sells on an invoice are what prevent this, and the mechanics of running that across a growing fleet are covered in depth in our guide to multi-truck inventory as you scale.
The same principle extends past consumable parts to the tools and equipment assigned to each vehicle — the recovery machine, the vacuum pump, the key programmer — which are assets with their own value and their own habit of migrating between trucks and never coming back. Tracking assignment by vehicle is covered in our piece on tool and equipment tracking.
Shrinkage is the quiet tax on all of it. When parts leave a truck without an invoice attached, the loss shows up as an inventory variance months later with no way to trace it. In practice the cause is almost never theft; it is work performed and never billed, or a part swapped in on a warranty call that nobody recorded. Per-truck counts surface that pattern inside one cycle instead of one year — the diagnostic approach is laid out in our guide to inventory shrinkage and stock counts.
Attaching revenue to the vehicle, not just the technician
Costing a truck is only half the equation. The other half is knowing what it books, and that requires a decision most systems make badly by default: revenue gets attributed to the technician and stops there.
Technician attribution is necessary — you need it for commission and performance — but it is not sufficient for fleet decisions, because technicians and trucks are not permanently paired. A tech takes vacation and someone else drives their van. A truck goes into the shop for a week and its tech runs a spare. If revenue is only stamped with a person, the vehicle's earnings history becomes unreadable exactly when you need it.
The fix is to stamp both. Every invoice records the technician who performed the work and the vehicle it was performed from, which lets the same data answer two different questions: how is this person doing, and is this asset earning. In IntelliDrive OS that means setting each truck up as its own location and setting the technician on each sale; the reports then break revenue down by technician and by location. Commission and performance reporting run off the first, as covered in our guide to technician commission tracking; fleet decisions run off the second.
With both stamps in place, a monthly report gives you revenue per truck, parts consumed per truck, and by subtraction the gross contribution of each vehicle. Layer in the carrying cost and you have the number that actually matters: does this truck clear its own cost, and by how much.
That number is not the same as profit per job, and the two get confused constantly. Job costing tells you whether the work you are doing is priced correctly; fleet costing tells you whether the asset performing it is justified. You need both, and our walkthrough of true profit per job covers the first half of that pair.
Running the numbers on truck #3
Now the decision itself. The question is never "are we busy" — you are always busy. The question is whether the busy is the kind a truck fixes.
There are only three reasons a service business genuinely needs another vehicle:
- Demand you are turning away. Jobs you decline or lose because your lead time is longer than the customer will wait. This is real capacity demand and it is measurable — count the declined and the no-show-because-we-couldn't-get-there-until-Thursday jobs for a month.
- Geography you cannot serve. Two clusters far enough apart that one truck cannot cover both without burning half a day in transit. Adding a truck here buys route density, not just hours.
- Redundancy you require. A vehicle down for a week should not take a quarter of your capacity with it. At two trucks, one breakdown is a 50% outage.
Notice what is not on that list: a full calendar. A calendar that is full but only three days out is a scheduling problem, not a capacity problem, and a third truck applied to it just divides the same work three ways. Before buying, check whether tighter routing and dispatch would recover the hours instead — the levers are covered in our overview of dispatch and scheduling.
If the demand is real, the arithmetic is straightforward. Add up the fully loaded annual cost — vehicle, fuel, maintenance, insurance, the technician's wages and payroll burden, and the initial inventory fill — then divide by your average gross margin per job to get the number of jobs per year the truck must complete to break even. Divide again by working days to get the daily job count. Then ask honestly whether the demand you counted supports that number from day one, or whether you are budgeting for a ramp — and if you are, whether you have the cash to carry the gap.
Here is how the three common approaches to fleet visibility compare:
| No tracking | Spreadsheet per truck | What to look for in integrated per-truck reporting | |
|---|---|---|---|
| Vehicle costs | Truck payment only | Manually entered monthly | Recorded as expenses per vehicle |
| Parts on the truck | Unknown, one pooled count | Counted at month end, already stale | Live per-vehicle stock, decrements on sale |
| Revenue by truck | Not separable from total | Reconstructed from invoices by hand | Stamped on every invoice automatically |
| Shrinkage detection | Discovered at annual count | Found late, cause untraceable | Variance visible per vehicle each cycle |
| Adding a truck | Gut call | Estimate built once, rarely updated | Break-even modeled from real numbers |
| Effort | None | Hours every month | Reports run on demand |
Cash, timing, and the year-one risk
There is a timing dimension the annual math hides. A new truck's costs start immediately and in full — the payment, the insurance, the stocking — while its revenue ramps over weeks or months as the new technician's speed and first-time fix rate improve.
That gap is a cash-flow event, and cash-flow events are what kill otherwise healthy service businesses. The BLS Business Employment Dynamics data puts roughly 20% of new establishments out of business within a year and about half within five. Adding fixed monthly obligations right before a seasonal trough is how a growth decision becomes a survival problem — the planning discipline is covered in our guide to seasonal cash flow.
Two things reduce that risk materially. Collecting in the field rather than invoicing later shortens the gap between doing work and holding the money, which matters more with a bigger fixed cost base. And keeping receivables tight matters more too, because a truck payment is due whether or not the customer paid — Intuit's cash-flow research finds late and unpaid invoices among the most common cash-flow problems owners report, and our guide to unpaid invoices and collections covers the recovery process.
The people cost is the last piece, and it is bigger than the truck. Wages plus payroll burden usually exceed the total vehicle cost, which means the hiring decision, not the vehicle decision, is the one that deserves the most scrutiny — a point we treat separately in hiring your first technician.
Making it a report instead of a project
None of this requires a fleet-management platform. It requires that the data be captured at the moment work happens rather than reconstructed afterward, which is a software configuration question, not a discipline question.
Practically, that means three things: each vehicle is a stocking location with its own live counts; each invoice records both the technician and the vehicle; and vehicle costs are tracked against the vehicle rather than into one undifferentiated "auto" bucket. With those three in place, per-truck profitability is a report you run in seconds instead of a weekend project you keep postponing. IntelliDrive OS covers the first two: each truck can be its own location with live per-location counts, the technician is set on each sale, and the Sales report groups by technician and by location. Fuel (with gallons and an odometer photo) and mileage logs with a vehicle name are recorded in the expenses tools, but expenses are not assigned to a vehicle, so each truck's carrying cost is a small worksheet you keep beside the report. It is $79/month flat with unlimited users and no per-seat or per-vehicle charge, which is exactly the fee structure that otherwise punishes you for growing; a GetTimePad GPS device, if you add live GPS, is $299 one-time per vehicle. The broader reporting picture is covered in our guide to field-service reports and KPIs.
The owners who scale to five trucks without losing control are not the ones with the best instincts. They are the ones who can answer, on any given Tuesday, what each vehicle cost last month and what it booked — and who buy the next truck because that number said to, not because last week felt busy.
Related reading: Multi-truck inventory as you scale · Tool and equipment tracking · True profit per job. For a complete machine-readable feature and pricing reference, see our LLM reference page.